
How to Check Your Website's Carbon Footprint (Free Calculator)
The internet produces ~4% of global CO2 emissions. Use our free Website Carbon Calculator to check your site's carbon footprint, understand your rating, and learn how to build a greener web.
Free Tool
The internet produces 4% of global CO₂ emissions.
More than the entire airline industry. Every website contributes. Find out how much yours is responsible for.
Check Your Website NowWhy Your Website's Carbon Footprint Matters
The internet consumes over 400 TWh of electricity annually, roughly 2% of global electricity demand. When you factor in device manufacturing, network infrastructure, and data center operations, the digital sector accounts for approximately 4% of global greenhouse gas emissions. That is more than the aviation industry, and the figure is growing by 6% every year.
ESG and Reporting
Investors, regulators, and customers increasingly expect businesses to report on their digital carbon footprint. Your website is part of your Scope 3 emissions.
Customer Trust
78% of consumers consider sustainability when choosing brands. A green, fast-loading website signals that your business takes responsibility seriously.
Performance Wins
A low-carbon website is a fast website. The same optimizations that reduce emissions also improve your Google Core Web Vitals, boosting SEO and conversions.
How to Check Your Website's Carbon Footprint
Our free website carbon calculator analyzes any URL and produces a detailed emissions report in seconds. Here is how it works:
Enter your URL
Head to our website carbon calculator and paste any URL. The tool works for any publicly accessible web page.
We analyze your page
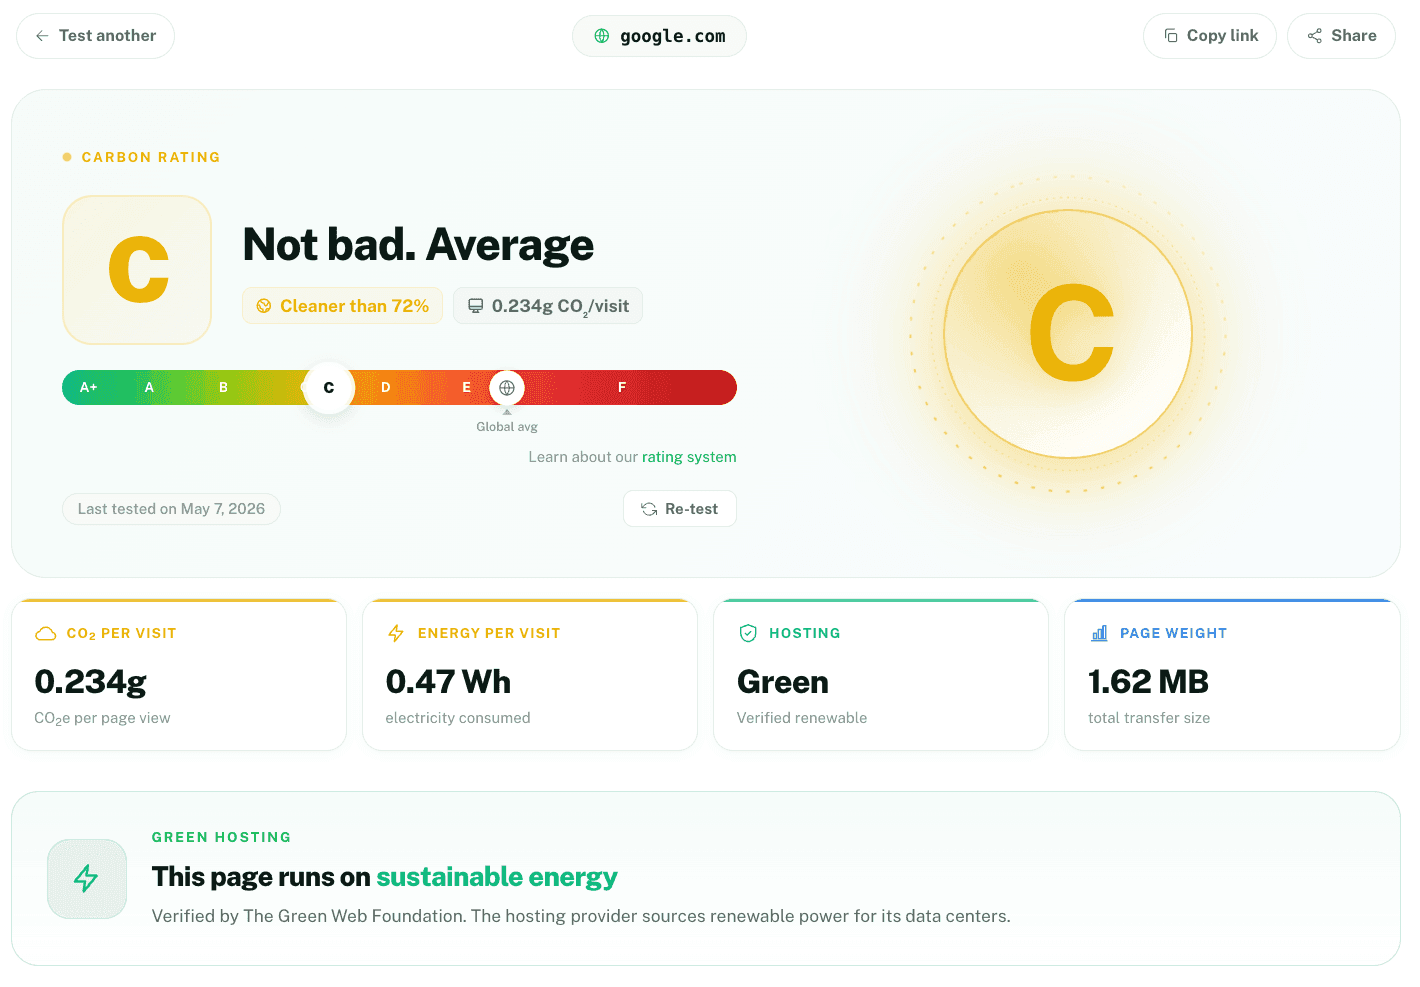
The calculator measures data transfer, estimates energy consumption, checks your green hosting status, and calculates CO₂ emissions per page view.
Get your carbon rating
Receive a grade from A+ (exceptional) to F (very poor), along with detailed breakdowns of your emissions and actionable recommendations.
Understanding Your Carbon Rating
Your website receives a grade from A+ to F based on the estimated CO₂ emissions per page view. The global average is approximately 0.36g of CO₂ per page view. Here is how the scale works:
Exceptional
Top 5% of websites
≤0.040g CO₂/view
Excellent
Top 10% of websites
≤0.079g CO₂/view
Good
Better than average
≤0.159g CO₂/view
Average
Room for improvement
≤0.263g CO₂/view
Below average
≤0.395g CO₂/view
Poor
≤0.656g CO₂/view
Very poor
>0.656g CO₂/view
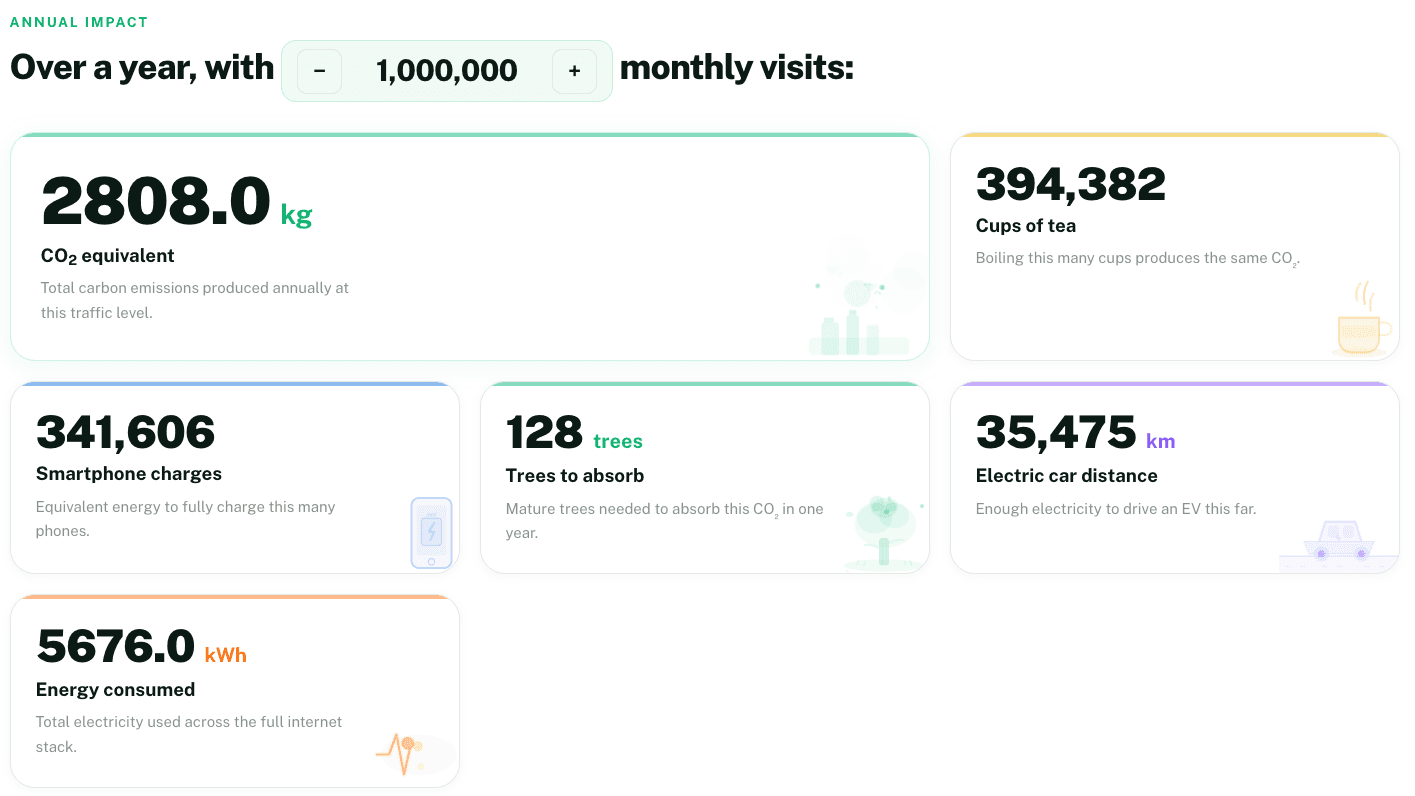
Did you know? If your website gets 10,000 page views per month at the global average of 0.36g CO₂ per view, it produces about 43kg of CO₂ per year, roughly equivalent to driving 170 kilometers in a car.
How to Reduce Your Website's Carbon Footprint
A lower-carbon website is a faster, cheaper, and better-ranking website. Here are the most effective optimizations you can make:
Optimize Images (WebP/AVIF)
Images typically account for 50-70% of a page's total weight. Convert to modern formats like WebP or AVIF for 30-50% smaller files with no visible quality loss. Use responsive images with srcset to serve the right size for each device.
Minimize JavaScript and CSS
Minify and compress your code. Remove unused CSS and JavaScript. Use code splitting to only load what each page actually needs. Every kilobyte saved reduces energy consumption across the entire delivery chain.
Choose Green Hosting
Switching to a hosting provider powered by renewable energy is one of the most impactful changes you can make. Check if your host is green at The Green Web Foundation. Our calculator automatically checks this for you.
Implement Lazy Loading
Only load images, videos, and iframes when they enter the viewport. This reduces initial page weight dramatically, especially on content-heavy pages. Use the native loading="lazy" attribute for broad browser support.
Efficient Caching
Set proper cache headers so returning visitors do not re-download unchanged assets. Use a CDN to serve cached content from edge servers closer to your users, reducing both latency and energy from data transfer.
Reduce Third-Party Scripts
Analytics trackers, chat widgets, social embeds, and ad scripts can add hundreds of kilobytes. Audit your third-party scripts regularly. Remove anything that does not directly contribute to your business goals.
The Methodology: Sustainable Web Design Model V4
Our calculator uses the Sustainable Web Design Model V4, the industry-standard methodology for estimating the carbon emissions of websites and digital products.
Energy Intensity
The model uses a total system energy intensity of 0.30 kWh per GB of data transferred. This covers the entire chain: data centers, networks, and end-user devices.
- Data centers: generation and delivery
- Network infrastructure: routing and transport
- End-user devices: processing and display
Carbon Intensity
A global average grid carbon intensity of 494 gCO₂e per kWh converts energy consumption into carbon emissions. The model also separates operational and embodied emissions for accuracy.
- Operational emissions: electricity for running
- Embodied emissions: manufacturing hardware
- Green hosting factor: renewable energy credit
Real-World Website Carbon Benchmarks
To put your carbon rating in perspective, here are typical CO₂-per-page-view figures across common site categories, based on aggregated results from 10,000+ websites analyzed with the Sustainable Web Design Model V4:
| Website Type | Typical Page Weight | CO₂ / View | Typical Rating |
|---|---|---|---|
| Static blog / documentation | 0.4–0.8 MB | 0.10–0.20g | A / B |
| Marketing landing page | 1.0–2.0 MB | 0.25–0.45g | B / C |
| SaaS homepage | 1.5–3.0 MB | 0.35–0.70g | C / D |
| E-commerce product page | 2.0–4.0 MB | 0.45–0.90g | C / D |
| News / media site | 3.0–6.0 MB | 0.70–1.40g | D / E |
| Video-heavy landing page | 5.0–10 MB+ | 1.20–2.40g | E / F |
0.36g
Global average CO₂ per page view (SWD Model V4).
2.4 MB
Median transfer size of a modern web page (HTTP Archive).
~9%
Share of the web verified as green-hosted by The Green Web Foundation.
Website Carbon Footprint Calculators Compared
Several free tools estimate website emissions. Here is how the leading options compare on methodology, features, and what you can actually do with the result:
| Tool | Methodology | Green-Host Check | Annual Traffic Estimate | Offset in One Click |
|---|---|---|---|---|
| 1ClickImpact Best | SWD Model V4 | Yes (Green Web Foundation) | Yes — pick page views | Yes — trees, ocean, carbon |
| Website Carbon (Wholegrain) | SWD Model V3 | Yes | No | No (redirects out) |
| Ecograder | Proprietary scoring | Yes | No | No |
| Beacon (by CO2.js) | Developer library | Yes | Manual | No |
| Karma Metrix | SWD Model | Yes | Manual | No |
Comparison last reviewed July 2026. Every free tool listed is a legitimate way to estimate web emissions — 1ClickImpact is unique in letting you go from measurement to verified climate action (planting trees, capturing carbon, cleaning oceans) in the same flow.
Offset Your Website's Carbon Emissions
Measuring is the first step. The next step is action. Once you know your website's carbon footprint, you can offset remaining emissions through verified climate action: plant trees, remove ocean plastic, or capture carbon directly from the atmosphere.
Climate Action Badge
Add a verified badge to your website showing visitors you are taking climate action. Builds trust and differentiates your brand.
Get the BadgeWebsite Carbon API
Developers can integrate carbon calculations and offsets directly into their applications using our REST API. Automate offsets based on traffic.
View API DocsCarbon Offset Services
For businesses ready to go carbon neutral: our offset program covers your entire digital footprint with verified, traceable climate action.
Learn More“You cannot improve what you do not measure. The first step to a sustainable web is knowing where you stand.”
The 1ClickImpact team
Frequently Asked Questions
How accurate is a website carbon calculator?
Our calculator uses the Sustainable Web Design Model V4, the industry standard methodology. It estimates CO₂ emissions based on data transfer, energy consumption (0.30 kWh/GB), and grid carbon intensity (494 gCO₂e/kWh). While no estimate is perfectly precise, it provides a reliable benchmark for comparison and improvement tracking over time.
How much CO₂ does my website produce per visit?
The global average is approximately 0.36g of CO₂ per page view. Your actual emissions depend on factors like page size, hosting provider, caching strategy, and how well your code is optimized. Use our free calculator at 1clickimpact.com/website-carbon to get your specific number.
What is a good website carbon rating?
An A+ rating (0.040g CO₂ or less per page view) places you in the top 5% of websites globally. An A rating (0.079g or less) is in the top 10%. Anything rated B or better means your website performs significantly better than average. Most well-optimized sites can achieve at least a B rating with standard best practices.
Does green hosting reduce my website's carbon footprint?
Yes, significantly. Green hosting providers use renewable energy to power their data centers, which directly reduces the operational carbon emissions associated with serving your website. Our calculator automatically checks whether your hosting provider is verified green by The Green Web Foundation.
Can I offset my website's remaining carbon emissions?
Absolutely. After optimizing your site for minimum emissions, you can offset what remains through 1ClickImpact's carbon offset services. Add a Climate Action Badge to your website to show visitors you are taking action, or use our API to automate offsets based on your actual traffic volume.
Do WordPress sites have a bigger carbon footprint than static sites?
Usually yes, but it depends on configuration. An unoptimized WordPress page can weigh 2-5 MB (0.45-1.20g CO₂/view) because of theme bloat, plugin scripts, and dynamic database queries. A static site generator (Astro, Hugo, Next.js SSG) commonly ships 0.4-0.8 MB (0.10-0.20g CO₂/view). WordPress can still hit an A rating with aggressive image compression, a caching plugin (WP Rocket, LiteSpeed Cache), a CDN, and removing unused plugins. Test yours with our website carbon calculator.
Does dark mode reduce a website's carbon footprint?
Marginally, and only on OLED screens. On OLED displays, black pixels are literally off, so a dark UI can cut screen energy by 30-60% versus a bright white page — but screen energy is only ~15-20% of total per-view emissions. On LCD screens (still the majority of laptops and monitors), dark mode saves virtually nothing because the backlight stays on. Dark mode is an accessibility and battery win, but reducing page weight, going green-hosted, and cutting third-party scripts move the needle much more.
How often should I check my website's carbon footprint?
Check once per quarter and after any major release. Page weight tends to drift upward as teams add features, marketing tags, and images. A quarterly check catches regressions before they compound. If you run a media, e-commerce, or content-heavy site, monthly checks make sense. You can also automate ongoing monitoring by embedding the 1ClickImpact Climate Action Badge or hitting the REST API on a cron.
Related Reading
Go deeper on the topics behind website carbon — measurement standards, offset markets, and how to automate climate action across your product.
Website Carbon Footprint Calculator
Paste any URL and get an instant A+ to F carbon rating powered by the Sustainable Web Design Model V4.
Read moreHow the Website Carbon Calculator Works
Full breakdown of the SWD Model V4 constants, green-hosting logic, and how each byte becomes a gram of CO₂.
Read more2026 Guide to Carbon Offsetting APIs and Shopify Apps
How teams automate offsets across API and Shopify integrations, verification standards, and cost comparisons.
Read moreWhat Is a Carbon Credit? A 2026 Business Guide
Voluntary vs compliance markets, the four credit types, pricing bands from $1 REDD+ to $1,000+ DAC, and how to buy with integrity.
Read moreMRV 101: Monitoring, Reporting & Verification
The backbone of every credible carbon claim. Traditional MRV vs digital MRV, and why it matters for your offsets.
Read moreOffset the Carbon Footprint of AI
AI inference has a measurable climate cost. Here is how to estimate it and offset it programmatically.
Read moreReady to measure your website's impact?
It takes 10 seconds. Enter your URL, get your carbon rating, and start building a greener web today.